Hydraulic waveforms: Examples and analysis
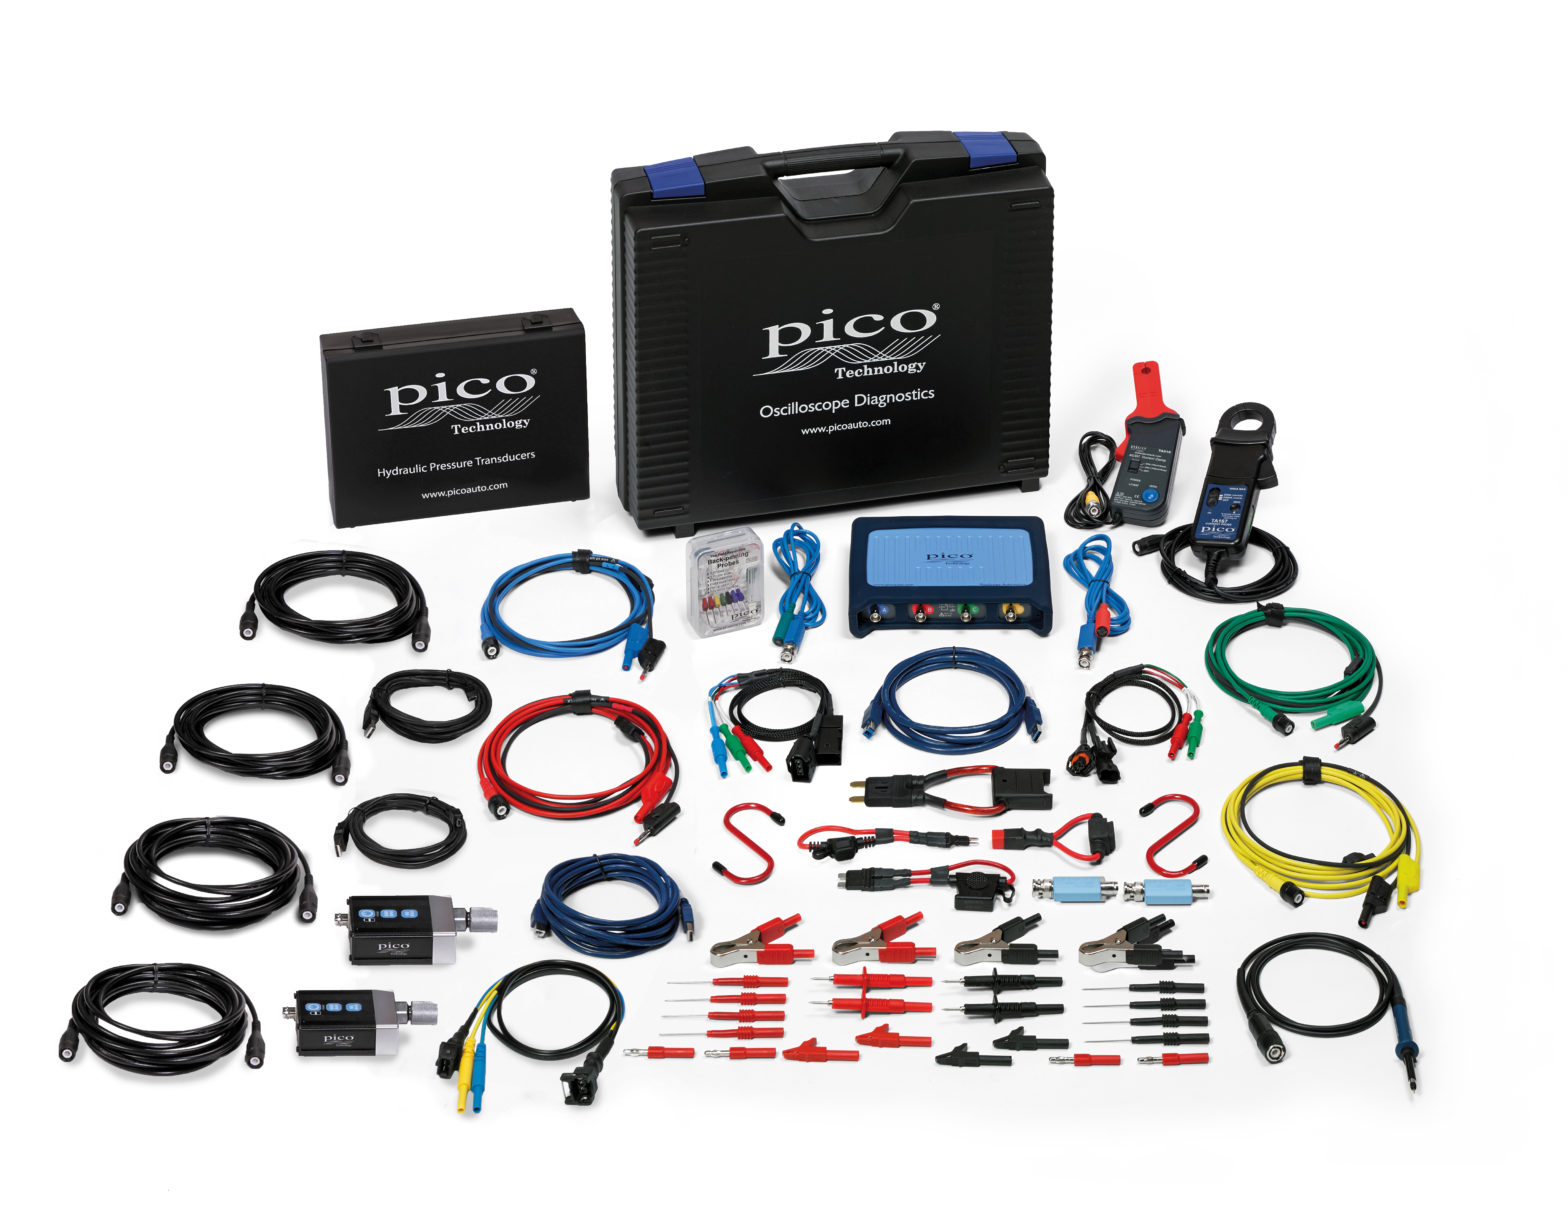
Pico’s Engine and hydraulics kit allows you to diagnose problems on your engine and hydraulics equipment. You can use it for simple tests of purely electric signals, such as extending and retracting a hydraulic ram, and for full system tests.
Typical uses for the engine and hydraulics kit:
The Engine and hydraulics kit lets you diagnose problems on your equipment relating to either engine or hydraulics. Allowing pressures up to 600 bar to be monitored against time enables you to connect the WPS600C to the relevant hydraulic test port, then view activity and transitions in hydraulic pressure that were never previously visible with conventional gauges.
- Hydraulic pump performance
- Hydraulic valve switching activity
- Hydraulic pressure control valve performance
- Hydraulic pressure decay
- Residual hydraulic pressure
Examples using the kit
The settings and connections you have to use depend on the test you want to perform and the vehicle you wish to test. Here we have compiled some examples to illustrate what possible waveforms you may see on the screen, and what to look for during the diagnostic process.
- Example 1 – Hydraulic ram on a tractor’s three-point hitch
- Example 2 – Hydraulic system on telehandler
- Example 3 – Hydraulic clutch pack
Example 1: Hydraulic ram on a tractor’s three-point hitch
Test: Extending and lowering the hydraulic ram on a tractor’s three-point hitch.
Example waveform:
- Channel A: Current on lowering solenoid
- Channel B: Current on lifting solenoid
- Channel C: Position sensor
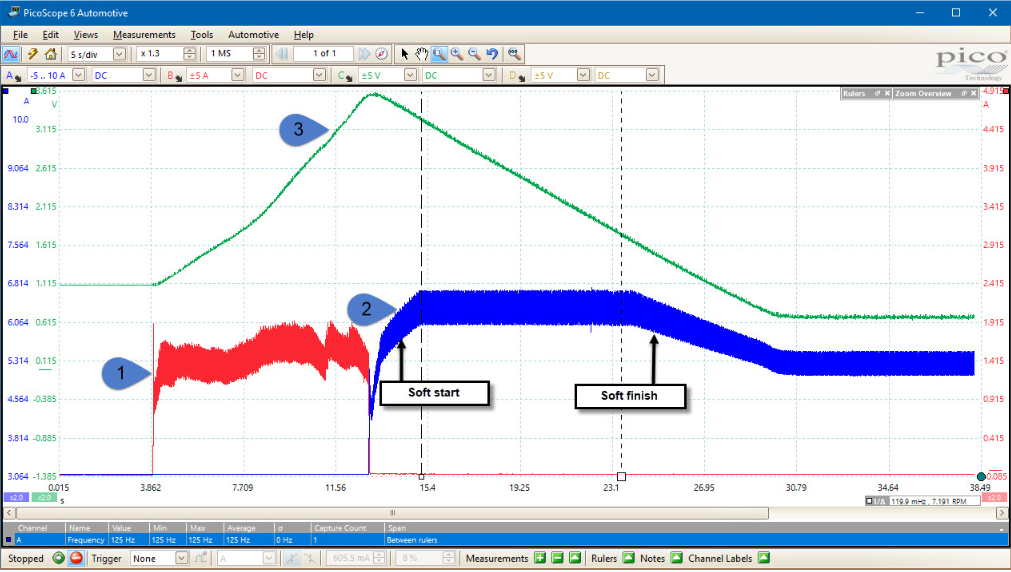
Waveform key:
- Lifting operation
- Lowering operation
- Position sensor voltage during lifting and lowering
Description:
This example shows you the difference in behavior between lifting and lowering. The lift was under manual control, and you can see that the waveform during this period is quite uneven. Lowering was under the control of the ECU, and here you can see that the waveform displays a soft start and finish.
The control valves used in this example are both pulse width modulated (PWM) dither valves. This means that the average current through them is proportional to the mark-space ratio of the controlling voltage signal, the midpoint current at any instant indicating the degree to which the valve is open or closed. The ripple on the PWM current shows the underlying frequency of the PWM signal (in this case 125 Hz).
Example 2: Hydraulic system on telehandler
With more advanced system testing, you can explore the operation of the whole system with one capture. In this example, we look at the performance of the hydraulic system on a telehandler using the TA377 300 lpm Webtec flowmeter (not included in the kit).
There is a huge amount of diagnostic information in this capture, showing both the basic operation of the system and some of the feedback controls built into this vehicle. Engine speed can be inferred from the crank speed sensor by using a measurement showing the frequency of the crank signal between two closely spaced rulers. As the crank sensor on this engine is a 60-tooth wheel with two teeth missing, engine RPM is almost the same as the crank sensor frequency (RPM is 3.5% higher). The vehicle was sitting with the boom raised and the forks pointing down.
Example waveform:
- Channel A: Crank speed sensor
- Channel B: Main control valve solenoid
- Channel C: Flow through aux (auxiliary) line
- Channel D: Hydraulic pressure at control valve output
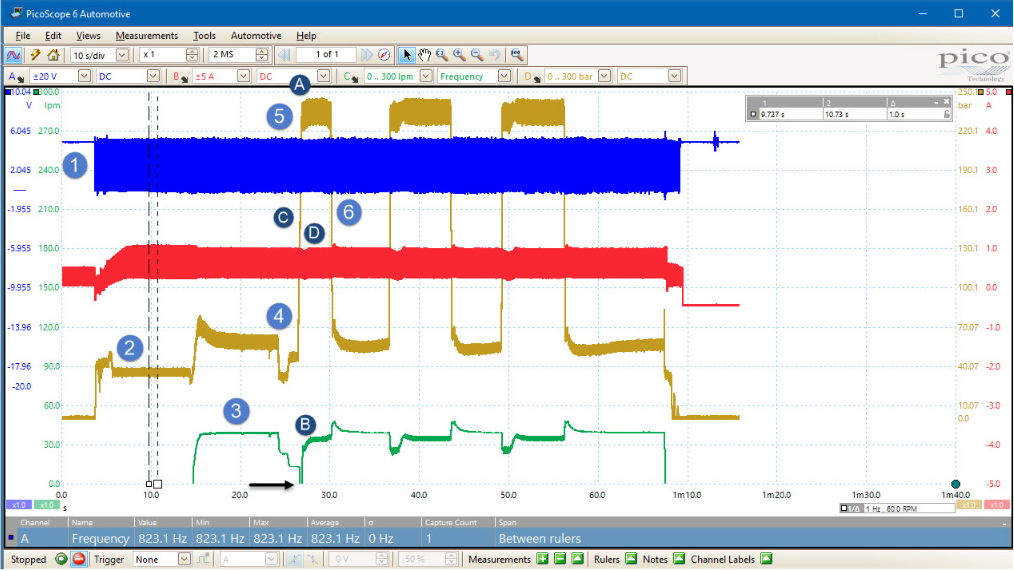
Waveform key:
- The engine is started – the crank sensor speeds up to its tick-over value and the hydraulic system pressurizes to its standby pressure. The dither control on the main valve starts at a minimum value and builds slowly to avoid stalling the engine.
- The waveform shows a steady state, with the engine idling and only the standby flow in the internal hydraulic system to provide lubrication for the main hydraulic components. Note: at this time there is no significant hydraulic flow in the aux line.
- The aux system is turned on with the full flow rate of 30 lpm going to tank. The engine speed remains constant. The hydraulic pressure at the pump has increased to cope with the flow through the aux line.
- The forks are lifted to apply some load to the system. As you can see, the flow to the ram has priority over the aux line and the flow in the aux line drops to near zero (the flow meter used had a minimum flow reading of around 15 lpm – below this value the scope trace will disappear off the bottom of the screen). As the forks start to lift, you can see the line pressure drop to near standby, as there is no real load on the forks and the standby pressure is enough to overcome gravity. As the ram reaches its end stop, you can see a small pressure step as the soft-finish function of the ram cuts in.
- With the forks fully up, the operator applies and maintains full pressure to the system to generatemaximum load. As this occurs, several things happen:
- First, the pressure goes to system maximum.
- The flow is switched back to the aux line as the forks cylinder no longer requires a significant flow.
- The engine slows down as the load comes on due to the increased power demand. If you calculate the engine speed as the system goes to max load you will see the approximate engine speed drop from around 820 RPM to 720 RPM. Once the revs have dropped by the preset amount, the engine’s anti-stall system cuts in to keep it running.
- The pulse width modulated (PWM) main control valve is backed off a small amount to unload the engine. You can see this in the way the max current (Channel B) dips slightly. This unloading, along with the engine’s electronic controls, allows the ECU to return the engine to the correct number of revs. An additional effect of the pressure backing off is the rounded nature of the initial corner as the pump goes to maximum pressure.
- The operator stops applying pressure to the forks cylinder. Although the forks do not actually move, you can see the pressure decay. When this happens, the load on the engine is removed and the engine starts to speed up. The engine ECU uses the hydraulic system as a brake and opens the main control valve slightly to apply more load to the engine, bringing its speed back to the correct value as quickly aspossible.
Description:
From this simple test, we can see how the system’s electronic control is applied to manage the operation of the complete system.
It is important to understand that a simple-sounding fault such as “the engine stalls when a heavy hydraulic load is applied” can be down to problems with either the engine or the hydraulic system. Having the ability to directly relate the hydraulic system’s performance to engine signals such as injectors or the crank sensor can show the technician not only what is happening, but also what the ECU expects to be happening, hence highlighting an issue.
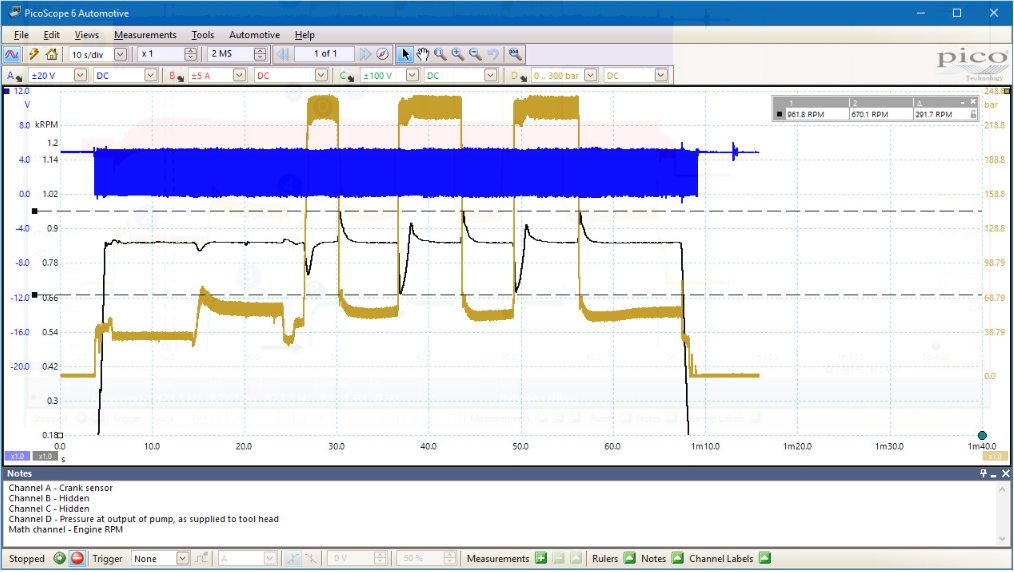
In PicoScope 6 you can set up a math channel to plot the engine RPM as it varies. This gives you a graphical view of the behavior of the engine anti-stall system. In the example below we are using a lowpass filter with a 2 Hz cut-off in order to remove the peaks that come from the missing teeth in the crank sensor reluctor wheel.
Example math channel formula: 1.034*LowPass(freq(A),2), with Units named as RPM and Max Range set at 1200.
1.034 is the correction factor to convert from 58 pulses per second from the crank sensor to RPM.
Example 3: Hydraulic clutch pack
This example is from a hydraulic clutch pack changing from Clutch A to Clutch B. It illustrates the real-world delays caused by the time it takes for the valve spools to move, oil to flow, and pressure to decay. Note that the entire changeover only takes 250 ms, and there is less than 200 ms between turning one solenoid on and turning the second off.
Example waveform:
- Channel A: Clutch B pressure
- Channel B: Clutch A pressure
- Channel C: Clutch B current
- Channel D: Clutch A current
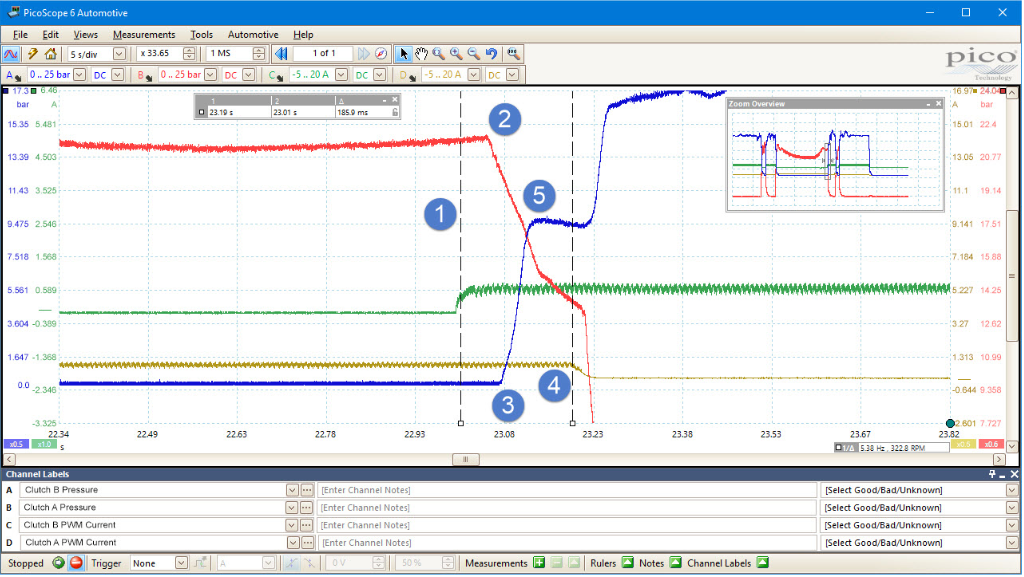
Waveform key:
- The solenoid in Clutch B is activated
- The pressure in Clutch A starts to decrease
- The pressure in Clutch B starts to increase
- The solenoid in Clutch A is deactivated
- The pressure in Clutch B plateaus until the clutch is deactivated. The pressure then rises to its full normal operating pressure
Description:
We can see that Clutch A is already engaged and that the pulse width modulated (PWM) signal to its control solenoid is active. Note that the pressure traces for the two clutches have different vertical scales.
When the clutch change is activated, first the power is turned on to Clutch B. For a short period of time nothing appears to happen. In fact, the spool moves within the directional control valve and oil starts to flow. Once the valve spool has moved far enough, we can see the pressure in Clutch A begin to decrease. With this clutch pack design, there is an internal gallery between the two clutches to speed operation. Initially the pressure decay is caused by oil flowing through the internal gallery and directly into Clutch B. As the hydraulic pump on this system (like many others) cannot supply the volume of oil required to fill the second clutch while already supplying oil to the first one, the system is designed to start filling the second clutch by using the oil draining from the first one.
When the second clutch comes on load (marker 5), the pressure stabilizes while the clutch plates move. During this period the pump is still supplying oil to both clutches, but the internal gallery is making sure the pressure in the two units equalizes as quickly as possible and that the pressure in Clutch A decreases as pressure builds in Clutch B. Note that the system is configured to make this crossover time, with both clutches driving, as small as possible to minimize clutch slippage and wear. The behavior of the system during this crossover period is critical to the smoothness of the changeover. If Clutch A fully disengages before Clutch B is ready, the vehicle will decelerate suddenly with a noticeable jerk. If the clutch overlap is too long, you will get accelerated wear of the clutch plates and excessive heating of the hydraulic oil.
When the solenoid in Clutch A is deactivated we see a small time delay while the valve spool moves to cut off flow to Clutch A. Once this is completed you can see that the pressure in Clutch A drops rapidly to tank pressure and that the pressure in Clutch B builds to normal operating pressure. The system is now operating normally with Clutch B fully engaged and Clutch A off.
Information taken from the PicoScope 6 software User’s guide, all copyrights ©Pico Technology.


Weitere News-Beiträge:
- PicoScope 9400A Serie — Überblick & Ergänzungen
- Saleae Logic Analyzer – kompakt, flexibel, leistungsstark
- UNI-T. Praxisgerecht. Preiswert.
- GVM-9102 – Hochspannungsmessung für Photovoltaik und DC-Systeme
- 📊 Für alle, die es ganz genau wissen wollen: Bode 100 & 500 liefern erstklassige Ergebnisse bei der Analyse von Schaltungen, Filtern & Netzteilen
Newsletter gefällig?
Wollen Sie in Sachen Messtechnik und Netzwerksicherheit immer am neuesten Stand bleiben? Dann schreiben Sie sich für unseren Newsletter ein: topaktuelle Themen, völlig kostenlos und jederzeit abbestellbar, sollten Sie doch nicht überzeugt sein.